
Fundamental Analysis
Bullish Momentum
Gold (XAUUSD) reached a new all-time high at $3,057.21 per ounce, driven by the Federal Reserve's decision to hold interest rates steady and project two rate cuts by the end of 2025. This weakened the U.S. dollar and boosted gold's demand as a safe-haven asset. Additionally, geopolitical tensions and trade policies from the Trump administration have increased global uncertainty, further reinforcing gold's appeal.
What Does the Futures Market Say?
- Open Interest: Slight decline from 537,836 to 536,068, suggesting some position closures.
- Volume: Increased from 170,965 to 176,017, indicating strong activity, possibly profit-taking or hedging.
Potential Correction?
The price retraced from its peak and now shows a head-and-shoulders pattern, a possible signal of correction if key support levels are broken.
Key of the Day: The COT Report, released today, has shown a steady reduction in long positions from major speculators. If this trend continues, it could increase the risk of a pullback in gold.
👀 What’s Next? If volume picks up and gold holds above key support levels, we could see another bullish attempt. Otherwise, selling pressure may intensify. Stay alert for the next moves!
Technical Analysis- XAUUSD, H4
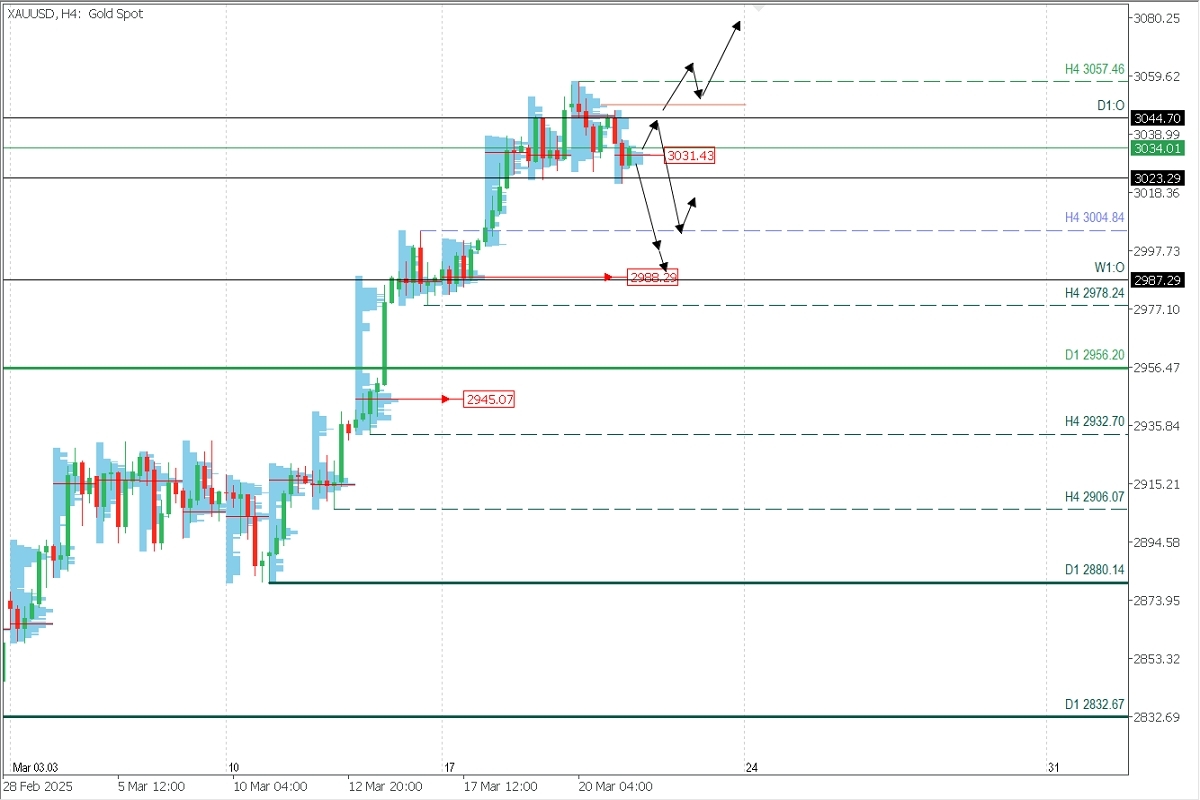
Supply Zones (Sell): 3044.70
Demand Zones (Buy): 3031.43 (still in development, could change) // 3004 // 2988.29
After reaching a new all-time high on March 20 at $3057.46, the price shows a head-and-shoulders reversal pattern, which could trigger a larger bearish correction if the neckline at $3023.29 is decisively broken.
Given the volume concentration in the early sessions around $3031.43, the price may increase towards the opening at $3044.70 before resuming selling. However, if the price breaks above $3047 towards $3057, the bearish scenario will be invalidated, favouring further bullish continuation towards $3070 and $3080.
However, the main scenario in this analysis is the development of a correction within the reversal pattern’s range. After breaking decisively below $3023.00, we expect a bearish extension towards $3004.84, and further towards the demand zone between $2995 and $2989, where bulls will likely react for a new rally.
Technical Summary
- Bearish Scenario: Sell below $3023 with TP at $3005 and $2995, where buys may be re-entered.
- Bullish Scenario: Buy above $2995.00 (waiting for the formation and confirmation of a reversal pattern on M5) with targets at $3030, $3040, and $3050.
POC Discovered: POC = Point of Control. This is the level or zone where the highest volume concentration occurred. If a previous bearish move followed from it, it is considered a resistance zone (sell zone). Conversely, if an upward move occurs from it, it is considered a buy zone, typically near lows, forming support.


